Showing posts with label heatwave. Show all posts

Wednesday, February 12, 2014

What ABC is teaching our Kids

ABC environment and the ABC "Splash" website have published an op ed by former weather presenter Rob Gell.

The piece(s) contain this glaring piece of sensationalism:

"Last year, 2013, was Australia's hottest year ever and we've started 2014 with another 50°C heatwave over inland Australia that then migrated to the southeastern states."

"another 50°C heatwave"!

Temperatures as measured at Bureau of Meteorology station did not pass 50°C this summer anywhere in Australia. The correct descriptor would be "another high 40s°C heatwave", but of course we get those every year! But where is the news in that? We have requested ABC investigate.

ABC promote "Splash" as 
  • a new world-class education website for Australia

Sadly it seems the site has the same respect for the facts as the rest of the ABC.

UPDATE:

The following from ABC: received today...

You are correct that no temperatures above 50 degrees were recorded in the period described. The story has been corrected.

ABC Digital Education apologises for this mistake.

Audience and Consumer Affairs are satisfied correcting the story adequately resolves the matter.

Score +1

Tuesday, January 21, 2014

BOM promulgate misinformation about the recent heatwave

It is sad when once trusted public institutions fail to correct their mistakes and promulgate misinformation. In its recent climate statement "Special Climate Statement 48 – one of southeast Australia’s most significant heatwaves" BOM make the following claim: (p.5):"Canberra also set a record with four consecutive days of 39°C."

This is debunked by data from its own weather station at ACTON (70099) that in January 1939 recorded 8 days in a row over 39 and nine days over 38, including a maximum temperature on the 11/1/1939 that is as yet unsurpassed:
Wednesday 11/1/1939: 108.4 (42.4)* beats the "official" Canberra Airport record by 0.2 degrees

How reliable is the BOM when it's an-aware of it's own data?

Its climate statement includes a figure purportedly showing the number of days per year on which at least one location in Victoria has reached 45°C. (2014 data as of 19 January): Figure 1. It starts in 1957. 
SCS48 Figure 1

There is a convenient footnote here that reads: 1957 is taken as the starting point as daily data prior to 1957 have not yet been digitised at a number of key locations (e.g. Ouyen, Horsham, Echuca), and hence this indicator would miss a number of days with temperatures above 45°C prior to 1957. 
So the graph is not an accurate record! We requested BOM supply information about how many stations were used in constructing the graph.

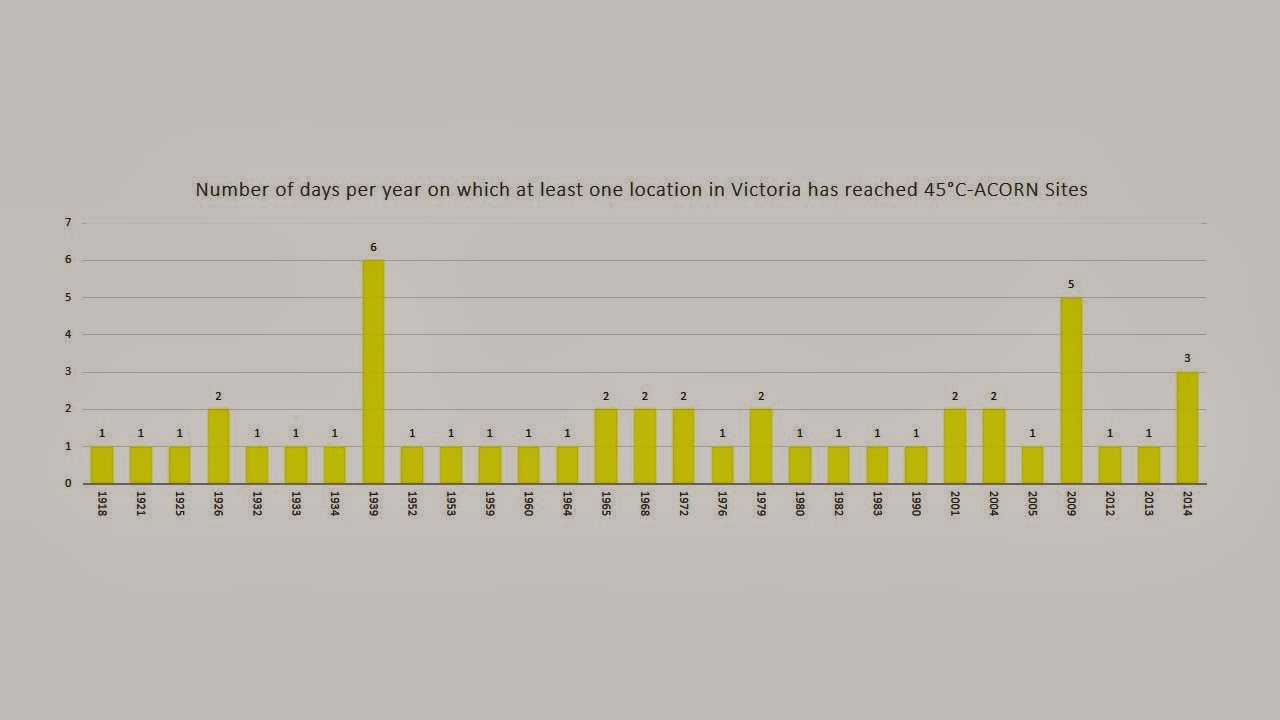
Based on data provided for the BOM's ACORN network for Victoria the following graph showing the number of days per year on which at least one location in Victoria has reached 45, can be produced for stations with over 100 years of digitised data:
Revised BOM Figure 1 using Victorian ACORN stations

This extends the information back to 1910 (earlier data is available but ACORN only starts in 1910) and places the recent heatwave in its historical context. 1939 remains the stand out year for extreme heat in Victoria.
Max. temp data for the following ACORN stations were used: 
76031: Mildura 1910 to present
82039: Rutherglen 1912 to present
80023: Kerang 1910 to present
86071: Melbourne 1910 to present
78015: Nhill 1910 to present
90015: Cape Otway 1910 to present - no readings above 45
85075: Sale 1945 to present-data not long enough for fair comparison- no readings over 45
87031: Laverton - data not long enough for fair comparison- 3 days over 45 on days matched by others with longer records-does not affect outcome in graph
85096: Wilson's Prom. 1910 to present - no readings above 45
84145: Orbost 1938 to present - data not long enough for fair comparison-  2 days over 45 on days matched by others with longer records-does not affect outcome in graph

The same ACORN data used below to provide an indication of days per decade over 45, you can make your own conclusions. 
Victoria ACORN data: days per decade over 45 degrees

UPDATE-response to our inquiries from Simon Birmingham Parliamentary Secretary to the Minister for the Environment:

Thank you for your correspondence of 19 January 2014, to the Minister for the Environment, the Hon Greg Hunt MP, concerning data from the closed Bureau of Meteorology station at Acton in Canberra. The Minister has forwarded your letter to me as the matters you raise fall within my portfolio responsibilities.

I can assure you that the Bureau takes matters raised by members of the public very seriously. I am advised that the Bureau is working to digitise as much of the early data records from various sites across the country as possible. Digitisation is a resource intensive task. Over the past decade, the Bureau has significantly increased its digitised holdings of historical climate data.

The Bureau has contacted the National Archives of Australia for the physical location of the specific data you have requested, and will contact you as soon as this information comes to hand. Acton is one of about 40 sites across Australia whose digitisation has been identified as a priority by the Bureau and this work will be carried out as staffing and other resources allow.

I am advised that Canberra has had no known periods when temperatures reached or exceeded 40°C on four consecutive days. This statement is not contradicted by the Acton data from January 1939, as those data do not contain any sequence of four consecutive days of 40°C or above. The maximum temperature at Canberra Airport on 17 January 2014 was 39.7°C, and hence there was also no such sequence during the 2014 heatwave.

In the broader context of your email, the Bureau agrees that extreme and prolonged heat was widely experienced in south-eastern Australia in 1939. The Bureau has characterised the recent January 2014 heatwave as one of the most significant in the nation’s history, sitting alongside the historically significant event of 1939, as well as the heatwave of 2009. Placing events in historical context is of great interest to the Australian community and for improving understanding of climate science.

Thank you for taking the time to write on this matter.



Sunday, January 19, 2014

Call that a Canberra Heatwave? No history at the BOM

The following letter sent to Environment Minister Greg Hunt:

Dear Minister,
I draw you attention to the following complaint sent by email to the Bureau of Meterology:

"BOM have provided the following statement to ABC News regarding the recent Canberra Heatwave:

Sean Carson from the Bureau of Meteorology says the ACT's saving grace so far this week has been the lack of wind.

"The wind will pick up a little bit over the coming days, certainly nothing too strong, but it will increase that fire danger rating," he said.

But Mr Carson says the heatwave is far from over.

"By the time we reach Saturday we might have seen four days in a row in the ACT greater than 40 degrees, something we've never seen before in Canberra's history," he said.


I draw BOM's attention to the records of its now closed ACTON station in the ACT (BOM station ID 70099) where the following temperatures were recorded as reported by the Canberra Times newspaper:

Saturday 7/1/1939: 101.7 (38.7)
Sunday 8/1/1939: 102.8 (39.3)
Monday 9/1/1939: 102.6 (39.2)
Tuesday 10/1/2013: 106.4 (41.3)
Wednesday 11/1/1939: 108.4 (42.4)* seems this should be the record beating GC's mention by 0.2
Thursday 12/1/1939: 103.6 (39.8)
Friday 13/1/1939: 107.4 (41.9)
Saturday 14/1/1939: 107.4 (41.9)
Sunday 15/1/1939: 105.4 (40.8)

Clearly BOM's official statements in relation to temperatures over 40 in Canberra are incorrect misrepresent the history of heatwaves in the nation's capital. In 1939 we very nearly had 7 days over 40. I request BOM provide an official correction to the ABC.

CC'd to Minister of Environment"

Can the Minister please ensure that the Bureau corrects the misinformation provided to ABC news above. Can the minister ensure that the BOM is providing accurate information to the public concerning Australian weather?

Update: Day for Day comparison of 2014 and 1939 heatwaves:
Saturday 7/1/1939: 101.7 (38.7)/Sunday 12/1/2014: 37.1
Sunday 8/1/1939: 102.8 (39.3)/Monday 13/1/2014:33.5
Monday 9/1/1939: 102.6 (39.2)/Tuesday 14/1/2014: 37.6
Tuesday 10/1/2013: 106.4 (41.3)/Wednesday 15/1/2014: 40.2
Wednesday 11/1/1939: 108.4 (42.4)/ Thursday 16/1/2014:40.1
Thursday 12/1/1939: 103.6 (39.8)/Friday 17/1/2014:39.7
Friday 13/1/1939: 107.4 (41.9)/Saturday 18/1/2014:40.0
Saturday 14/1/1939: 107.4 (41.9)/Sunday 19/1/2014:32.3
Sunday 15/1/1939: 105.4 (40.8)/Monday 20/1/2014:

Tuesday, January 14, 2014

Heatwaves of times past

According to the ABC it seems that other government acronym, the BOM, has finally got about defining what a "heatwave" is:
For the first time, the Bureau of Meteorology has provided a national definition of a heatwave.

A heatwave is now defined by three or more days of unusually high maximum and minimum temperatures in any area.

Seems we had a different definition in the not so distant past...
 They enjoy a heat wave

The Great Heatwave of 1908, the year BOM was formed, provides a different definition and a reminder that what goes around may come around again....Thankfully in these enlightened times, along with an approved heatwave definition, we also have access to air con.

THE GREAT HEAT WAVE. The Coburg Leader 25 January 1908.  The heat wave which swept over the greater portion of Victoria for the past fortnight, and which has caused so many deaths and so much distress,was severely felt in Brunswick, and caused a number of deaths, especially among infants and the old and feeble. Day after day the sun rose like a ball of fire over Brunswick, while the heat of the solar rays was supplemented by scorching hot winds and dust,which caused the thermometer to rise rapidly until over 112 degrees was registered in the shade. Doubtless the hot winds were the result of the up-country bush fires, the hot air making its way southwards towards the sea. Then at night there was little relief. The red haze even obscured the moon, and the conditions were so oppressive that many women and children had to sleep in their gardens and under their verandahs,while others, bolder still, slept in the parks underneath the trees-in fact anywhere where a cool spot could be found from the oppressive conditions which everywhere prevailed.

BOM still records January 1908 as having the highest January monthly mean on record for Melbourne at 31.0. There were 6 days in a row over 39.9 degrees including a run of 5 over 40!


Saturday, January 4, 2014

Brisbane: Hot but not hot enough

ABC Headline: Queensland heatwave: Brisbane set to roast as weekend temperatures soar
The scorching heatwave gripping much of Queensland is being felt in Brisbane today, with residents set to roast in temperatures of up to 41 degrees Celsius.

Thankfully ABC reported reality, but as always a slant put on it: Queensland heatwave: Brisbane spared predicted maximum temperature, Bureau of Meteorology says
Brisbane has been spared the full wrath of the Queensland heatwave, with temperatures today peaking just below the predicted high of 41 degrees Celsius.
The mercury reached a top of 38.7C just after 1:00pm, Bureau of Meteorology forecaster Pradeep Singh said, a mark just shy of the expected peak and several degrees below the January record of 43.2C. 


What is the date on that  record? The city's highest recorded temperature was 43.2 °C (110 °F) on 26 January 1940.  What was the CO2 reading at the time? Below 315ppm

Degrees below: 43.2-38.7=4.5!

"just below", "just shy"?! Percentage difference: 9.44% in weather terms this hardly qualifies "just", but when you are spruiking alarm what do the facts matter?

The alternate headline reads: Brisbane heatwave: BOM wrong again!

On that 1940 temperature record here's one article from the archive. Seems global warming was much worse back then!"

GREATEST HEATWAVE IN STATE"S HISTORY: EIGHT DEATHS 
BRISBANE, January 26.
Eight people died in Queensland to-day at a result of the greatest heat the State has ever known. Three cases occurred in Brisbane and five in the country. Forty-three people collapsed in Brisbane and many more in the country. Brisbane experienced the highest temperature in its history—109.8 degrees at 2.35 p.m.

Nothing like this figure has been re-corded during the 85 years that the Meteorological Bureau has been operating. The nearest was 108.9 in January, 1902. To make matters worse, today's heat was accompanied by a record relative humidity of 20 per cent.The record day was followed by the hottest January night since 1922. The temperature at 9 p.m. was 83.3.

Heatwave: a quick question

ABC are tracking a "heatwave" over Australia. The lead in sentence reads:
As a heatwave hits inland Australia and temperatures top 50 degrees Celsius, track the weather across the country with our animated visualisation, updated hourly.

We bolded the claim about temps topping 50 degrees Celsius. A quick look at the BOM's weather extremes page doesn't show any readings above 50. We have asked ABC for an explanation.

Friday, August 16, 2013

Extreme extrapolations more common

ABC did not find the time to report on recent news revealing problems with climate models. Instead they have covered a paper that uses climate models to provide a taste of future heat waves. Not surprisingly defective models highly geared to an exaggerated climate sensitivity produce extreme outcomes.

Extreme heat waves to become more common
In their study, Dim Coumou, from the Potsdam Institute for Climate Impact Research, and Alexander Robinson, from Universidad Complutense de Madrid used climate modelling to project extreme heat waves like those that hit Australia in 2009.
They found that extreme heatwaves will by 2020 affect about 10 per cent of total land area -- double today's figure. By 2040, it would have quadrupled.
And just one indication of the reliability of those models?

In contrast to earlier analyses for a ten-year period that indicated consistency between models and observations at the 5% confidence level, we find that the continued warming stagnation over fifteen years, from 1998 -2012, is no longer consistent with model projections even at the 2% confidence level.

In odd contravention of the normal rules of journalism ABC allow this "press release" to be published without question.

Naive journalism: the new standard in news from our public broadcaster.

Update: Some further comments at Judy Curry's Climate Etc blog. Curry one of ABC's missing climate commentators.


Variability of the AMO in the 10–20/70–80 year ranges is overestimated/underestimated in the models and the variability in the 10–20 year range increases in three of the models from the CMIP3 to the CMIP5 versions.