Showing posts with label BOM. Show all posts

Tuesday, September 12, 2017

Missing News: What temperatures are BOM recording?

The Australian have been covering and interesting and newsworthy story concerning problems BOM have in recording temperatures (eg Push for probe into weather stations failures). This is their basic role, you'd think by now they could get it right.
Given the importance of temperature in the land of droughts and flooding rains we are astounded that the ABC has failed to provide any coverage.

Jennifer Marohasy has an important series of articles on her blog that outline the problem. See...

Two Decades of Temperature Data from Australia – Not Fit for Purpose

Are Recordings from Electronic Devices Comparable – or Not?

Vindicated: Bureau acknowledges limits set on how cold temperatures can be recorded

Vindicated: Bureau not following WMO guidelines

Bureau Management Rewrites the Rules – Again

Monday, August 21, 2017

Delusions of climate

ABC once again uncritically report on some BOM figures that show "record" temperatures for the NT.
Here's the script...

Duty forecaster at the BOM in Darwin, Peter Markworth, said during the weekend Borroloola and the Tiwi Islands both experienced their hottest recorded August days.

Borroloola reached 37.7 degrees Celsius, beating its previous record of 37.3C, Mr Markworth said.

Batchelor, about 70 kilometres south of Darwin, hit 37C on Friday, beating its previous record of 36.8C.

On Saturday it hit 37.2C, breaking the record again.

The article ends by claiming: 

Mr Browning (BOM regional manager of climate services) said the NT had experienced a different weather pattern to normal. "We seem to have been seeing more of the winds coming from the east than the south-east," Mr Browning said. "The south-easterlies really bring the cool temperatures from down south, but we're just not seeing that as much." He said the warmer-than-expected weather seen in July and so far this month were "consistent with global warming signals".

Now there are quite a number of definitions of climate. One used by the WMO is as follows:
What is Climate?
Climate in a narrow sense is usually defined as the "average weather," or more rigorously, as the statistical description in terms of the mean and variability of relevant quantities over a period of time ranging from months to thousands or millions of years. The classical period is 30 years, as defined by the World Meteorological Organization (WMO). 
The "records" claimed for both Borroloola and Batchelor are from weather stations with less than 30 years of data!!!Unfortunately for the BOM these stations are unable to say anything about climate change as they have not measured more than one "Climate Cycle". Seriously bad science!


Wednesday, August 2, 2017

Inconvenient facts about NT's Hot July

ABC's ineffectual reporters once again fail to ask any questions in regurgitating a BOM report on a hot July in the top end.
ABC's report identified the following key points:

Key points:
  1. Some places saw temperatures between 3C and 4.5C above long-term average
  2. In Darwin the overnight low only dropped below 20C six times
  3. BOM says "hard to say if this is new normal"
Let's look at these one by one.
1. Some places saw temperatures between 3C and 4.5C above long-term average
ABC failed to question the BOM about the how the long term averages are currently determined. The changes quoted by BOM are based on the ACORN data. This is a manufactured dataset based on an undisclosed homogenisation algorithm with arbitrary adjustments (see below). For the NT it is derived from a handful of stations. The NT covers 1.421 million km²; over such a large area how useful is an average based on just a handful of homogenised stations? 

2. In Darwin the overnight low only dropped below 20C six times
So what! Based on the actual measurements from the Old Darwin Post Office (14016) and Airport (14015) this is not out of the ordinary and has been surpassed on quite a few occasions. It might have been worth the BOM pointing out that in 1915 NO (yes zero) nights dropped below 20C, and that there have been warmer overnight averages in Darwin the past (see tables below). ABC's reporter may have asked on how many occasions this had occurred previously and what was the record?

# nights below 20C-Selected months Darwin Post Office (BOM 14016) (More if you look).
1906:1
1915:0
1916:1
1917:2
1920:1

3. BOM says "hard to say if this is new normal"
As usual ABC (and BOM) omit any context or history in claims involving climate change. The graphs below show actual mean maximum and minimum temperatures for Darwin Post Office (BOM 14016) and Darwin Airport (14015) for July from the start of records in 1869. For the Post Office observations were collected in a Stevenson Screen from at least 1890. For the Darwin area this shows a cyclic pattern of temperature variation in both Min and Max means. Interestingly, based on the un-adjusted data there is little change in the long term means. Mean temperatures provide little information about weather experienced on a day by day basis. As usual ABC (and BOM's) reporting is superficial, omits key information and fails to inform.

Jennifer Marohasy has an informative post on homogenisation of Darwin's temperature record. See HERE.

Addendum
As an indication of the arbitrary nature of BOM's homogenisation process the list below shows recorded and ACORN minimum temperatures, and the difference for Darwin Post Office (14016) for July 1915. The range of adjustments over the period lack any credibility.

1915 (JULY) RECORDED ACORN DIFF
1st 21.7 21.1 0.6
2nd 21.2 20.1 1.1
3rd 21.7 21.1 0.6
4th 21.8 21.2 0.6
5th 21.7 21.1 0.6
6th 21.8 21.2 0.6
7th 22.3 21.7 0.6
8th 23.1 22.3 0.8
9th 22.3 21.7 0.6
10th 21.4 20.5 0.9
11th 20.1 19.2 0.9
12th 21.4 20.5 0.9
13th 22.5 21.9 0.6
14th 23.3 22.5 0.8
15th 23.3 22.5 0.8
16th 23.8 23 0.8
17th 23.1 22.3 0.8
18th 21.7 21.1 0.6
19th 22.8 22.1 0.7
20th 23.2 22.4 0.8
21st 22.3 21.7 0.6
22nd 23.1 22.3 0.8
23rd 21.8 21.2 0.6
24th 21.1 20 1.1
25th 21.4 20.5 0.9
26th 21.8 21.2 0.6
27th 22.6 21.9 0.7
28th 23.1 22.3 0.8
29th 21.9 21.2 0.7
30th 22.2 21.6 0.6
31st 22.5 21.9 0.6

Tuesday, August 1, 2017

Another cyclone forecast BOMs out

A characteristic of ABC News is it's lack of inquiry in testing the outcomes of predictions on climatic events made by experts. One would think that the outcome of predictions would be newsworthy given the amount of money the government allocates to our premier weather agency.

The Bureau of Meteorology annually release an outlook of the coming tropical cyclone season in Spring. We have previously  looked at the accuracy of BOM's cyclone forecasts and ABC's reluctance to cover the disparity between forecast and outcomes, but have not had a chance to follow up on recent pronouncements.

Looking at the 2016-2017 season last year ABC reported that "Weather forecasters are expecting an average to above-average number of tropical cyclones to form this season in the region that includes the Northern Territory."

BOM claimed with a "high" level of accuracy :

  • The Australian region has a 67% chance of having more tropical cyclones than average, meaning a 33% chance of having fewer tropical cyclones than average. Typically, around four tropical cyclones cross the Australian coastline in a season. Outlook accuracy for the Australian region is high.

So what was the outcome? It seems BOM no longer produce the Darwin Tropical Diagnostic Statement that provided a near real time summary of cyclone activity. Perhaps its buried somewhere else in it's labyrinthine web page. However Wikipedia produce a season summary:  

Once again the numbers paint a poor picture of BOM's cyclone forecast skill, but ABC don't think this is newsworthy.

Tuesday, March 31, 2015

Pre-1910 Stevenson Screens - BOM does not know!

Australia has a rich history of scientific endeavour. For weather observations most states had standardised Stevenson Screens installed by the 1890s yet the Bureau of Meteorology (BOM) only extend its official national temperature series back to 1910, conveniently skipping over the Federation Drought when temperatures appear to be higher than present. Through correspondence with the Federal Government's environment Minister Greg Hunt (see reply from the BOM below) we find that the BOM does not even know precisely how many stations were fitted with Stevenson Screens or when this occurred. Worth repeating. Our premier meteorological organisation fueled by $100's of millions of tax dollars, that is tasked with the responsibility for looking after our weather data, does not know where or when Stevenson Screens were installed, and is unable to supply this data in a digital format. The hand written ledgers probably collecting dust and disintegrating somewhere in BOM's data vault. Un - %$&##$@ - believable!

The enabling legislation for the BOM includes the following functions


(1)  The functions of the Bureau are:

(a)  the taking and recording of meteorological observations and other observations required for the purposes of meteorology;

(b)  the forecasting of weather and of the state of the atmosphere;

(c)  the issue of warnings of gales, storms and other weather conditions likely to endanger life or property, including weather conditions likely to give rise to floods or bush fires;

(d)  the supply of meteorological information;

(e)  the publication of meteorological reports and bulletins;

(f)  the promotion of the use of meteorological information;

(g)  the promotion of the advancement of meteorological science, by means of meteorological research and investigation or otherwise;

(h)  the furnishing of advice on meteorological matters; and

(i)  co‑operation with the authority administering the meteorological service of any other country (including a Territory specified under subsection 4(2)) in relation to any of the matters specified in the preceding paragraphs of this subsection.

Sadly the BOM is clearly not fulfilling its functions. Sadly the government couldn't care less.

Sent Environment Minister Greg Hunt


February 18, 2015


RE: Availability of data from weather stations with standard instrumentation prior to 1910


Dear Minister,

The Bureau of Meteorology currently produce a series of homogenised weather products (eg ACORN). These only extend back to 1910 due apparently to the lack of standard equipment (Stevenson Screens) across the country. However a large number of weather stations had Stevenson screens installed prior to 1910.


I recently enquired with the BOM about the availability of data for one such station at the former Musgrave Telegraph Station in northern Queensland (refer email attached) and was advised that records prior to 1991 have not been digitised.


This station, and others along the telegraph line were equipped with Stevenson Screens and appropriate thermometers and rain gauges from 1887. It is remarkable given the controversy surrounding climate data that our Nation’s repository of weather data have not digitised and made available the complete data record for stations such as this (ie stations with standard equipment) so they can be incorporated into national climate data or made available for use by university and independent researchers.


Can the Minister provide an answer the following simple questions:

1. How many of the nation’s weather stations had Stevenson Screens installed prior to 1910?

2. Which of the nation’s weather stations had Stevenson Screens installed prior to 1910?

3. Will the minister ensure that data from these stations is digitised and made freely available online for study?


Regards

Marc Hendrickx

The Minister's minion at the Bureau replies. Astonishingly, when it comes to Stevenson Screens, BOM do not know where or when!



Tuesday, February 10, 2015

ACTON update

BOM have finally put up the daily min records for the ACTON weather station. This provides another case where the records need to be adjusted. In its Special Climate Statement 48 BOM asserted on page 4...
"On the 17th, Canberra (39.7°C/11.2°C) had its largest diurnal range on record, 28.5°C"

Looking  over the records for the Canberra heatwave in January 1939 we find the exact same diurnal range was recorded at the ACTON station on January 13 1939 when this first class weather station recorded a max of 41.9 and a min of 13.4.

BOM continue to disregard history!


The BOM's ACTON weather station in 1921-according to BOM it may as well not exist!


12/2/2015...Reply from BOM after we pointed out their error...(seems like they have been infected by ABC disease)

Dear Marc,

The Special Climate Statements are prepared to describe major climate events close to the time that they occur.

For this reason, the reports indicate that the data are valid at the time of writing, and each report provides the date that the final data were sourced.

This provision is necessary since the data may change subsequently for a number of reasons, such as late-arriving manual observations, or subsequent quality control and analysis that may revise the data.

Special Climate Statement 48 was prepared on the 19th January 2014, and carries the following advice.

"This statement is based on data available as of 19 January 2014. Some changes may occur as a result of late-arriving data or the Bureau’s routine quality control procedures.”

Rainfall records in particular are commonly subject to such revisions, and the Bureau does not typically amend previous reports unless a substantial update is required.

In this case, there has been no change to the data considered in the report at the time of writing. The record referenced in Special Climate Statement 48 is for Canberra Airport (station numbers 70014 and 70351). This is detailed in table 3 of the report.

While recently digitised data from Acton has not yet been quality controlled, the observations for January 1939 are consistent with surrounding locations, and show that the 1939 heatwave was one of the most significant on record for the southeast. This information is already provided in the report.

"Over most parts of this region, it ranked alongside the heatwaves of January-February 2009, January 1939 and (from the limited information available) January 1908 as the most significant multi-day heatwaves on record.”

Regards,
Climate Analysis Section

Thursday, September 11, 2014

Bureau BOMS out on history

Thought a summary version of our FACT checking of BOM records might be of interest:

In recent weeks The Australian newspaper has exposed serious issues with the manner in which the Bureau of Meteorology analyse Australia’s temperature records. (See articles HERE, and HERE). BOM’s ACORN dataset is the result of a statistical homogenisation process. This sometimes produces warming trends from data collected at high quality stations where the station records themselves often show cooling trends. It seems some of the adjustments made are justified but some it seems are not.
While the meteorological community continue to debate the details over the validity of BOM’s analytical processes in adjusting historical records I thought readers might be interested to know how BOM treat some of its historical data.
In January this year eastern Australia experienced a heatwave. This was similar to past heatwaves. It seems it was not as severe or widespread as heatwaves in 1960 or in 1939. Nonetheless the episode was out of the ordinary and worthy of the attention of our weather experts. BOM dutifully reported on the heatwave and released a “Special climate statement”: number 48titled “One of southeast Australia’s most significant heatwaves”.
According to the Bureau Special Climate Statements:  provide a detailed summary of significant weather and climate events. They are produced on an occasional basis for weather/climate events which are unusual in the context of the climatology of the affected region. Their purpose is to document major events. In doing so, they serve as a historical record, inform the public on the broader historical and climatological context for events, and give easy access to data and information which is in high demand from the media and the public.
On page 5 of statement number 48 BOM state: "Canberra also set a record with four consecutive days of 39°C." The “record” was also picked up by ABC’s weather guru Graham Creed in his ABC Weather Man blog. This “record” set my sceptical senses tingling and I set about a little fact checking.
After a brief check through the National Library Newspaper Archive I came across a few headlines from the Canberra Times that indicated the BOM had got things wrong. In fact the newspaper records showed that in a remarkable 7 day stint from the 8th of January 1939 to the 14th of January the BOM’s ACTON weather station in Canberra recorded 7 days over 39 degrees, including 4 days over 40, along with ACT’s record maximum temperature of 42.8 degrees on January 11, 1939. The ACTON station was closed in late January 1939 and a weather new station was opened at Canberra Airport.
I passed this advice on the ABC’s weather guru who corrected his blog to indicate the 4 consecutive days were in fact recorded at BOM’s newer Canberra Airport Station. The blog was not updated to reference the newspaper stories or the 1939 weather records.
I requested the daily records for ACTON from the Bureau but for some reason this station in our nation’s capital only had monthly data.  It’s only the nation’s Capital! After contacting the minister, the Bureau indicated it would as a matter of priority, collate the data and place it on its website. This was back in January.
Earlier last week, about 8 months after my request, I received an email from the Bureau to indicate the maximum temperature readings for ACTON were now online. I checked and they confirmed the Newspaper reports. Not wanting the historical record to be in error I requested BOM correct its Climate Statement. This is the response:
The record referenced in Special Climate Statement 48 is a station record for Canberra Airport (station numbers 70014 and 70351), as is stated in Table 3. 
It seems the historical record will be forever tainted! According to the Bureau’s climate statement the record heatwave of 1939 did not happen in Canberra. This despite the Bureau’s own data showing it did.

BOM’s homogenisation process may be valid or not, but it seems its handling of the nation’s weather records, based on its handling of ACTON, leaves much to be desired. 

Saturday, September 6, 2014

Correcting Errors at the BOM: ACTON UPDATE

In its climate statement "Special Climate Statement 48 – one of southeast Australia’s most significant heatwaves" BOM make the following claim: (p.5):"Canberra also set a record with four consecutive days of 39°C."

BOM describe their special climate statements in the following way:
The Bureau's Special Climate Statements provide a detailed summary of significant weather and climate events. They are produced on an occasional basis for weather/climate events which are unusual in the context of the climatology of the affected region. Their purpose is to document major events. In doing so, they serve as a historical record, inform the public on the broader historical and climatological context for events, and give easy access to data and information which is in high demand from the media and the public.

THEY SERVE AS A HISTORICAL RECORD

We requested BOM make a correction to the climate statement about Canberra's recent "record" which is now shown to be false as the BOM's Canberra ACTON station shows the following run of highs in January 1939:
Jan 1939 records indicate 7 consecutive days over 39°C between the 8th and 14th.
Jan 8: 39.3
Jan 9: 39.2
Jan 10: 41.1
Jan 11: 42.8
Jan 12: 39.8
Jan 13: 41.9
Jan 14: 40.8

BOM responded thus:
Fri, Sep 5, 2014 at 1:42 PM
The record referenced in Special Climate Statement 48 is a station record for Canberra Airport (station numbers 70014 and 70351), as is stated in Table 3.

Regards,
Climate Analysis Section

Our response:
The main text does NOT indicate this and in its current form it is misleading. Please correct the main text.
BOM provide the following description of its Special Climate Statements...
Special Climate Statements
The Bureau's Special Climate Statements provide a detailed summary of significant weather and climate events. They are produced on an occasional basis for weather/climate events which are unusual in the context of the climatology of the affected region. Their purpose is to document major events. In doing so, they serve as a historical record, inform the public on the broader historical and climatological context for events, and give easy access to data and information which is in high demand from the media and the public.


As BOM consider the statements "serve as a historical record" it is of utmost importance that errors are corrected. BOM's statement on page 5...that "Canberra also set a record with four consecutive days of 39°C." is clearly in error and requires correction.

It is common practice in scientific reports for a corrigendum to be issued to correct mistakes made in published papers. Given the historical importance BOM place on its special climate statements it seems the issue of a corrigendum is appropriate in this case.

Wednesday, September 3, 2014

ACTON ONLINE

Earlier this year the Bureau of Meteorology made the following claim in respect to temperatures in Canberra:

 In its recent climate statement"Special Climate Statement 48 – one of southeast Australia’s most significant heatwaves" BOM make the following claim: (p.5):"Canberra also set a record with four consecutive days of 39°C."

We took the BOM up on this and also ABC's weather man Graham Creed (here and here and here and here)

BOM have finally digitised the daily max. temp records for its ACTON station. The records may be found HERE

They accord with the information we found revealing the following run of high temps:
Jan 6: 36.2
Jan 7: 38.7
Jan 8: 39.3
Jan 9: 39.2
Jan 10: 41.1
Jan 11: 42.8
Jan 12: 39.8
Jan 13: 41.9
Jan 14: 40.8

We sent the following new request to BOM's climate services branch:
In your  "Special Climate Statement 48 – one of southeast Australia’s most significant heatwaves" BOM make the following claim: (p.5):"Canberra also set a record with four consecutive days of 39°C."

With the release of the daily maximum figures for ACTON station this is now clearly false. Please correct the statement.

http://www.bom.gov.au/jsp/ncc/cdio/weatherData/av?p_nccObsCode=122&p_display_type=dailyDataFile&p_startYear=1923&p_c=-982875403&p_stn_num=70099

Jan 1939 records indicate 7 consecutive days over 39°C between the 8th and 14th.

Tuesday, January 21, 2014

BOM promulgate misinformation about the recent heatwave

It is sad when once trusted public institutions fail to correct their mistakes and promulgate misinformation. In its recent climate statement "Special Climate Statement 48 – one of southeast Australia’s most significant heatwaves" BOM make the following claim: (p.5):"Canberra also set a record with four consecutive days of 39°C."

This is debunked by data from its own weather station at ACTON (70099) that in January 1939 recorded 8 days in a row over 39 and nine days over 38, including a maximum temperature on the 11/1/1939 that is as yet unsurpassed:
Wednesday 11/1/1939: 108.4 (42.4)* beats the "official" Canberra Airport record by 0.2 degrees

How reliable is the BOM when it's an-aware of it's own data?

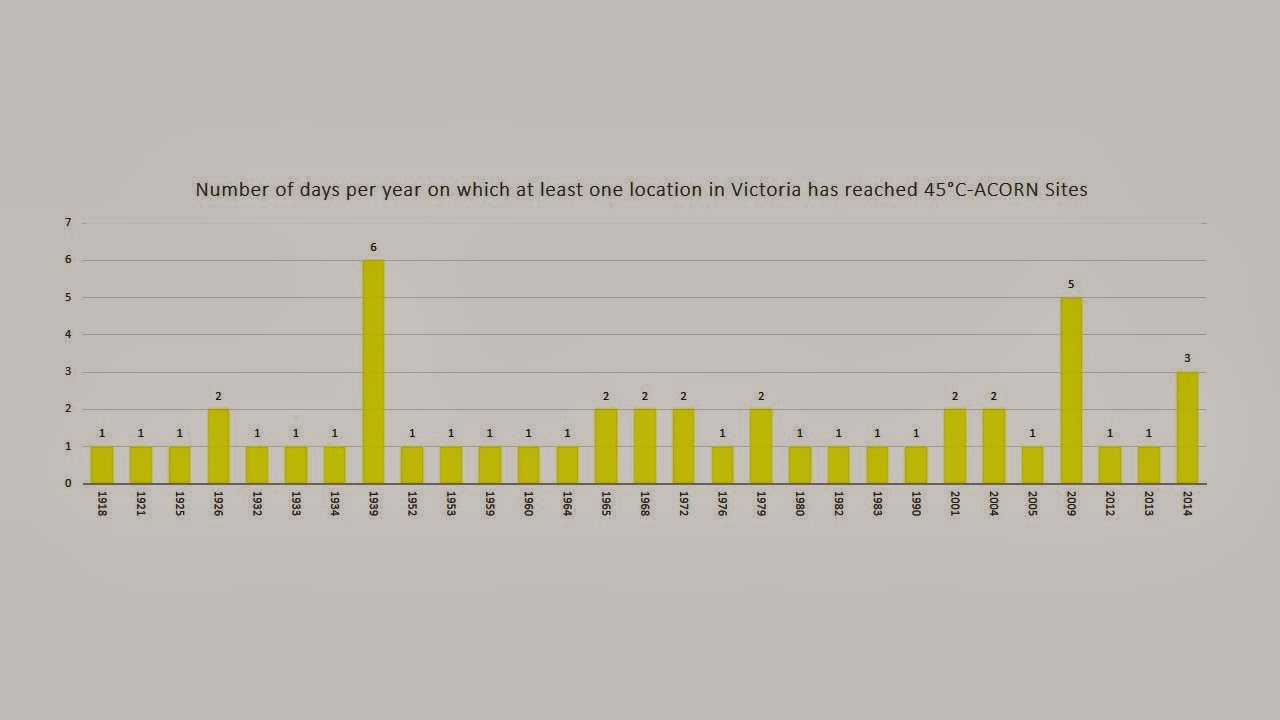
Its climate statement includes a figure purportedly showing the number of days per year on which at least one location in Victoria has reached 45°C. (2014 data as of 19 January): Figure 1. It starts in 1957. 
SCS48 Figure 1

There is a convenient footnote here that reads: 1957 is taken as the starting point as daily data prior to 1957 have not yet been digitised at a number of key locations (e.g. Ouyen, Horsham, Echuca), and hence this indicator would miss a number of days with temperatures above 45°C prior to 1957. 
So the graph is not an accurate record! We requested BOM supply information about how many stations were used in constructing the graph.

Based on data provided for the BOM's ACORN network for Victoria the following graph showing the number of days per year on which at least one location in Victoria has reached 45, can be produced for stations with over 100 years of digitised data:
Revised BOM Figure 1 using Victorian ACORN stations

This extends the information back to 1910 (earlier data is available but ACORN only starts in 1910) and places the recent heatwave in its historical context. 1939 remains the stand out year for extreme heat in Victoria.
Max. temp data for the following ACORN stations were used: 
76031: Mildura 1910 to present
82039: Rutherglen 1912 to present
80023: Kerang 1910 to present
86071: Melbourne 1910 to present
78015: Nhill 1910 to present
90015: Cape Otway 1910 to present - no readings above 45
85075: Sale 1945 to present-data not long enough for fair comparison- no readings over 45
87031: Laverton - data not long enough for fair comparison- 3 days over 45 on days matched by others with longer records-does not affect outcome in graph
85096: Wilson's Prom. 1910 to present - no readings above 45
84145: Orbost 1938 to present - data not long enough for fair comparison-  2 days over 45 on days matched by others with longer records-does not affect outcome in graph

The same ACORN data used below to provide an indication of days per decade over 45, you can make your own conclusions. 
Victoria ACORN data: days per decade over 45 degrees

UPDATE-response to our inquiries from Simon Birmingham Parliamentary Secretary to the Minister for the Environment:

Thank you for your correspondence of 19 January 2014, to the Minister for the Environment, the Hon Greg Hunt MP, concerning data from the closed Bureau of Meteorology station at Acton in Canberra. The Minister has forwarded your letter to me as the matters you raise fall within my portfolio responsibilities.

I can assure you that the Bureau takes matters raised by members of the public very seriously. I am advised that the Bureau is working to digitise as much of the early data records from various sites across the country as possible. Digitisation is a resource intensive task. Over the past decade, the Bureau has significantly increased its digitised holdings of historical climate data.

The Bureau has contacted the National Archives of Australia for the physical location of the specific data you have requested, and will contact you as soon as this information comes to hand. Acton is one of about 40 sites across Australia whose digitisation has been identified as a priority by the Bureau and this work will be carried out as staffing and other resources allow.

I am advised that Canberra has had no known periods when temperatures reached or exceeded 40°C on four consecutive days. This statement is not contradicted by the Acton data from January 1939, as those data do not contain any sequence of four consecutive days of 40°C or above. The maximum temperature at Canberra Airport on 17 January 2014 was 39.7°C, and hence there was also no such sequence during the 2014 heatwave.

In the broader context of your email, the Bureau agrees that extreme and prolonged heat was widely experienced in south-eastern Australia in 1939. The Bureau has characterised the recent January 2014 heatwave as one of the most significant in the nation’s history, sitting alongside the historically significant event of 1939, as well as the heatwave of 2009. Placing events in historical context is of great interest to the Australian community and for improving understanding of climate science.

Thank you for taking the time to write on this matter.