Monday, February 3, 2014

A sit down and a chat

ABC need to have a sit down and chat about its performance on so many issues. Endemic groupthink has pushed public confidence in the organisation to new lows. Some recent op eds set the tone:

Andrew Bolt: The ABC is out of control and its boss simply attacks its critics.
Henry Ergas: But to ensure good use of the community's resources, it is not enough to ask whether the public service broadcasters are doing what they do properly; one must also ask whether they are doing the right things.
Paul Sheehan: This brings into question the judgment of the news and current affairs division, and its self-perpetuating, cultural proclivities at the most basic, granular and reflexive level.

Some further comment at Catallaxy: The ABC is in trouble

Update Good line in an Oz editorialAn examination of facts shows the ABC's reporting of torture claims against the navy was wrong, unjustified, incorrect and irresponsible, whatever its motives. 

Tuesday, January 28, 2014

No nano follow up

SMH report today: Scientists discover nanoparticles in sunscreen are harmlessWe previously pointed out the misinformation being spread about zinc in sunscreens by AM Other ABC stories have been equally sensationalist and misleading. Just wondering how long it will take ABC's AM or its news division to notice this latest development. Bet the views of Friends of the earth will be given prominence.

We asked ABC's Alan Sunderland for comment.

UPDATE: Right on cue ABC cover the story and no surprise they give prominence to activist opinions of a career environmental campaigner over the experts. In comments FOE's Louise Sales further misrepresents the results of the recent work and further exaggerates the risks of nano-particles. 

We asked report author Simon James for more information. Here is his reply:
Here is some clarification about the current work; Zn is an essential nutrient, our bodies must have Zn in order to function (similar to iron or calcium). In 2013 the Therapeutic Goods Administration (TGA) released a review of the literature (attached) which concluded ZnO nanoparticles present in sunscreens pose no risk to consumers when used as intended. Our manuscript dose acknowledges previous work which demonstrated that a very, very small amount of Zn from ZnO nanoparticles present in sunscreen can penetrate the skin when used in the field (attached). I want to be very clear that this work showed that the Zn from ZnO nanoparticles made up less than 0.001% of the total Zn detected. This is not a level of Zn which is associated with any safety concerns (to be honest I am impressed the authors could even make such a precision measurement). However, given the limitations of doing a field studies the authors could not conclude whether the Zn made it into the body as part of intact nanoparticles or in some other form. Our study built on this finding by asking the question, “If the nanoparticles do penetrate the skin can a macrophage break these objects down?” We are not the first to try and answer this question, indeed our work is merely a single study adding to a much larger body of work but we were able to go further than other groups and show direct evidence for cell mediated breakdown of ZnO nanoparticles.

Saturday, January 25, 2014

Tuesday, January 21, 2014

BOM promulgate misinformation about the recent heatwave

It is sad when once trusted public institutions fail to correct their mistakes and promulgate misinformation. In its recent climate statement "Special Climate Statement 48 – one of southeast Australia’s most significant heatwaves" BOM make the following claim: (p.5):"Canberra also set a record with four consecutive days of 39°C."

This is debunked by data from its own weather station at ACTON (70099) that in January 1939 recorded 8 days in a row over 39 and nine days over 38, including a maximum temperature on the 11/1/1939 that is as yet unsurpassed:
Wednesday 11/1/1939: 108.4 (42.4)* beats the "official" Canberra Airport record by 0.2 degrees

How reliable is the BOM when it's an-aware of it's own data?

Its climate statement includes a figure purportedly showing the number of days per year on which at least one location in Victoria has reached 45°C. (2014 data as of 19 January): Figure 1. It starts in 1957. 
SCS48 Figure 1

There is a convenient footnote here that reads: 1957 is taken as the starting point as daily data prior to 1957 have not yet been digitised at a number of key locations (e.g. Ouyen, Horsham, Echuca), and hence this indicator would miss a number of days with temperatures above 45°C prior to 1957. 
So the graph is not an accurate record! We requested BOM supply information about how many stations were used in constructing the graph.

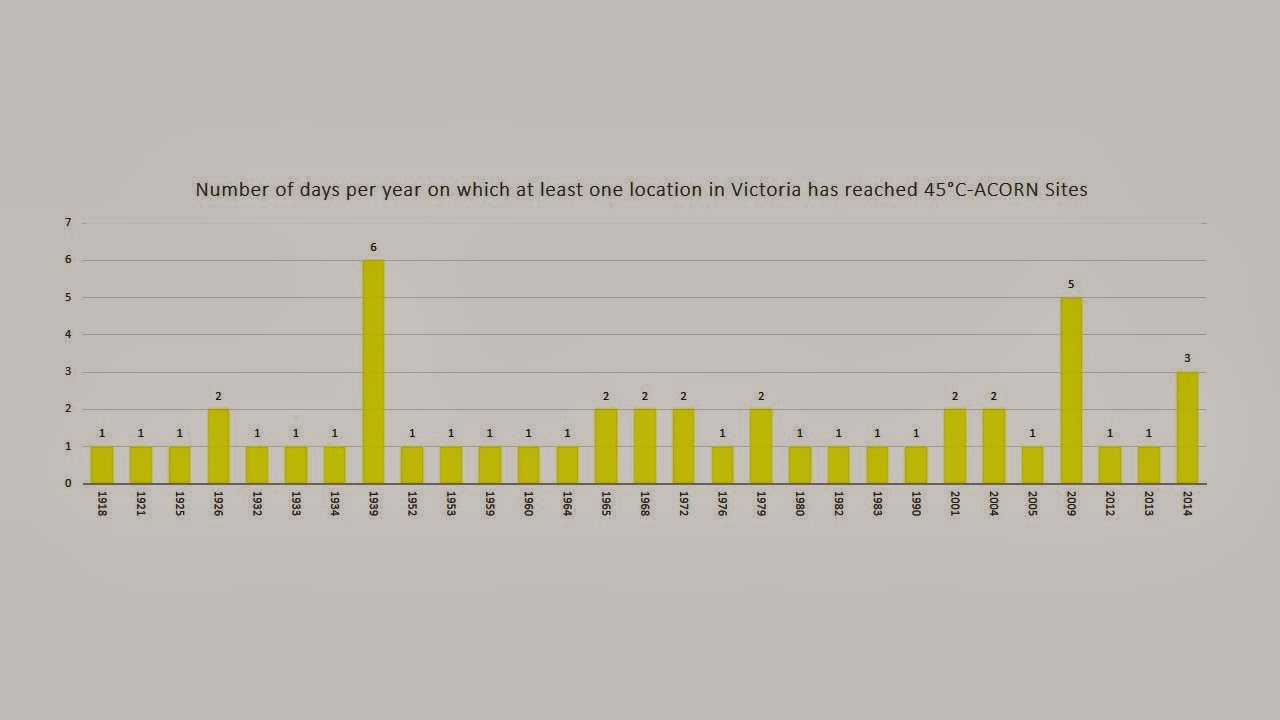
Based on data provided for the BOM's ACORN network for Victoria the following graph showing the number of days per year on which at least one location in Victoria has reached 45, can be produced for stations with over 100 years of digitised data:
Revised BOM Figure 1 using Victorian ACORN stations

This extends the information back to 1910 (earlier data is available but ACORN only starts in 1910) and places the recent heatwave in its historical context. 1939 remains the stand out year for extreme heat in Victoria.
Max. temp data for the following ACORN stations were used: 
76031: Mildura 1910 to present
82039: Rutherglen 1912 to present
80023: Kerang 1910 to present
86071: Melbourne 1910 to present
78015: Nhill 1910 to present
90015: Cape Otway 1910 to present - no readings above 45
85075: Sale 1945 to present-data not long enough for fair comparison- no readings over 45
87031: Laverton - data not long enough for fair comparison- 3 days over 45 on days matched by others with longer records-does not affect outcome in graph
85096: Wilson's Prom. 1910 to present - no readings above 45
84145: Orbost 1938 to present - data not long enough for fair comparison-  2 days over 45 on days matched by others with longer records-does not affect outcome in graph

The same ACORN data used below to provide an indication of days per decade over 45, you can make your own conclusions. 
Victoria ACORN data: days per decade over 45 degrees

UPDATE-response to our inquiries from Simon Birmingham Parliamentary Secretary to the Minister for the Environment:

Thank you for your correspondence of 19 January 2014, to the Minister for the Environment, the Hon Greg Hunt MP, concerning data from the closed Bureau of Meteorology station at Acton in Canberra. The Minister has forwarded your letter to me as the matters you raise fall within my portfolio responsibilities.

I can assure you that the Bureau takes matters raised by members of the public very seriously. I am advised that the Bureau is working to digitise as much of the early data records from various sites across the country as possible. Digitisation is a resource intensive task. Over the past decade, the Bureau has significantly increased its digitised holdings of historical climate data.

The Bureau has contacted the National Archives of Australia for the physical location of the specific data you have requested, and will contact you as soon as this information comes to hand. Acton is one of about 40 sites across Australia whose digitisation has been identified as a priority by the Bureau and this work will be carried out as staffing and other resources allow.

I am advised that Canberra has had no known periods when temperatures reached or exceeded 40°C on four consecutive days. This statement is not contradicted by the Acton data from January 1939, as those data do not contain any sequence of four consecutive days of 40°C or above. The maximum temperature at Canberra Airport on 17 January 2014 was 39.7°C, and hence there was also no such sequence during the 2014 heatwave.

In the broader context of your email, the Bureau agrees that extreme and prolonged heat was widely experienced in south-eastern Australia in 1939. The Bureau has characterised the recent January 2014 heatwave as one of the most significant in the nation’s history, sitting alongside the historically significant event of 1939, as well as the heatwave of 2009. Placing events in historical context is of great interest to the Australian community and for improving understanding of climate science.

Thank you for taking the time to write on this matter.


Monday, January 20, 2014

Canberra Temperature Data-more history than you are led to think

Based on its run down on Canberra's weather (HERE) and recent media statements (HERE) our Bureau of Meteorology would have you believe that there were no official temperature measurements made in our nation's capital prior to March 1939.

However as we have discovered thanks to errors made by ABC's weather man, there was indeed an earlier BOM station at ACTON (70099) that operated from 1914 through to December 1939. It recorded, temperature and rainfall such as THESE observations for January 1939.

We asked BOM whether it had the daily temperature records available for this station and got the following initial response from one of BOM's Climate Data Officers (to save embarrassment we won't reveal any names):

Thank you for your enquiry.  Acton 70099 only recorded rainfall from 1913-1939 and rainfall intensity (pluviograph) 1921-1939.  The site never recorded temperatures.   Canberra Forestry recorded temperature 1957-1980, Canberra City 70282 1974-1988, Canberra Airport 70014 1939-2010, Canberra AP (new) 2008-now.

To which we replied:
In regard to 70099 you make the following statement "The site never recorded temperatures", yet mean monthly temperature data is available for this station on the BOM climate data site. See:http://www.bom.gov.au/jsp/ncc/cdio/weatherData/av?p_nccObsCode=36&p_display_type=dataFile&p_startYear=&p_c=&p_stn_num=70099
Can you please clarify your comments. On the facts at hand you appear to be incorrect. 

This came shortly after:
Thank you for your enquiry.  To correct the earlier sent correspondence, daily temperature data for Acton (70099) is as yet undigitised, we are only able to provide monthly records from our digital database.  The original paper records of temperature observations from 1914 to 1939 for the site are stored in National Archives of Australia (NAA).  We have contacted NAA to assess where these records are physically stored and will inform you of this as soon as possible.  The Bureau is constantly working to digitise as much of the early record as possible.   

We forwarded our exchange to Minister Hunt with the following query:

Dear Minister,
The above correspondence for your information and action.
Given the historical significance of historical temperature readings at the old BOM weather station at Acton can the Minister please inform me of when the records will be made available to the pubic.

Who am I?

"A democratic society depends on diverse sources of reliable information and contending opinions."
ABC Editorial policy

Pop Quiz: Who am I?

Professor and Chair of the School of Earth and Atmospheric Sciences at theGeorgia Institute of Technology and President (co-owner) of Climate Forecast Applications Network (CFAN). I received a Ph.D. in Geophysical Sciences  from the University of Chicago in 1982.  Prior to joining the faculty at Georgia Tech, I held faculty positions at the University of Colorado, Penn State University and Purdue University. I currently serve on the NASA Advisory Council Earth Science Subcommittee and the DOE Biological and Environmental Science Advisory Committee,  and have recently served on the National Academies Climate Research Committee and the Space Studies Board, and the NOAA Climate Working Group. I am a Fellow of the American Meteorological Society, the American Association for the Advancement of Science, and the American Geophysical Union.

Intelligent, top of their field, numerous peer reviewed publications, a world leader, articulate, concise, open, an award winning scientist. Seems someone ABC might want to get an opinion from, yet somehow this person is passed over in favour of lesser mortals.

Their latest testimony to the US Senate now available HERE.

Extract...

  • For the past 16 years, there has been no significant increase in surface temperature. There is a growing discrepancy between observations and climate model projections. Observations since 2011 have fallen below the 90% envelope of climate model projections
  • The IPCC does not have a convincing or confident explanation for this hiatus in warming.
  • There is growing evidence of decreased climate sensitivity to atmospheric carbon dioxide concentrations
  • Based on expert judgment in light of this evidence, the IPCC 5thassessment report lowered its surface temperature projection relative to the model projections for the period 2016-2036.
The growing evidence that climate models are too sensitive to CO2 has implications for the attribution of late 20th century warming and projections of 21st century climate change. Sensitivity of the climate to carbon dioxide, and the level of uncertainty in its value, is a key input into the economic models that drive cost-benefit analyses, including estimates of the social cost of carbon.


Sunday, January 19, 2014

Call that a Canberra Heatwave? No history at the BOM

The following letter sent to Environment Minister Greg Hunt:

Dear Minister,
I draw you attention to the following complaint sent by email to the Bureau of Meterology:

"BOM have provided the following statement to ABC News regarding the recent Canberra Heatwave:

Sean Carson from the Bureau of Meteorology says the ACT's saving grace so far this week has been the lack of wind.

"The wind will pick up a little bit over the coming days, certainly nothing too strong, but it will increase that fire danger rating," he said.

But Mr Carson says the heatwave is far from over.

"By the time we reach Saturday we might have seen four days in a row in the ACT greater than 40 degrees, something we've never seen before in Canberra's history," he said.


I draw BOM's attention to the records of its now closed ACTON station in the ACT (BOM station ID 70099) where the following temperatures were recorded as reported by the Canberra Times newspaper:

Saturday 7/1/1939: 101.7 (38.7)
Sunday 8/1/1939: 102.8 (39.3)
Monday 9/1/1939: 102.6 (39.2)
Tuesday 10/1/2013: 106.4 (41.3)
Wednesday 11/1/1939: 108.4 (42.4)* seems this should be the record beating GC's mention by 0.2
Thursday 12/1/1939: 103.6 (39.8)
Friday 13/1/1939: 107.4 (41.9)
Saturday 14/1/1939: 107.4 (41.9)
Sunday 15/1/1939: 105.4 (40.8)

Clearly BOM's official statements in relation to temperatures over 40 in Canberra are incorrect misrepresent the history of heatwaves in the nation's capital. In 1939 we very nearly had 7 days over 40. I request BOM provide an official correction to the ABC.

CC'd to Minister of Environment"

Can the Minister please ensure that the Bureau corrects the misinformation provided to ABC news above. Can the minister ensure that the BOM is providing accurate information to the public concerning Australian weather?

Update: Day for Day comparison of 2014 and 1939 heatwaves:
Saturday 7/1/1939: 101.7 (38.7)/Sunday 12/1/2014: 37.1
Sunday 8/1/1939: 102.8 (39.3)/Monday 13/1/2014:33.5
Monday 9/1/1939: 102.6 (39.2)/Tuesday 14/1/2014: 37.6
Tuesday 10/1/2013: 106.4 (41.3)/Wednesday 15/1/2014: 40.2
Wednesday 11/1/1939: 108.4 (42.4)/ Thursday 16/1/2014:40.1
Thursday 12/1/1939: 103.6 (39.8)/Friday 17/1/2014:39.7
Friday 13/1/1939: 107.4 (41.9)/Saturday 18/1/2014:40.0
Saturday 14/1/1939: 107.4 (41.9)/Sunday 19/1/2014:32.3
Sunday 15/1/1939: 105.4 (40.8)/Monday 20/1/2014: